
The numbers that grow a shop.
Revenue, appointments, clients, no-shows, top services and how the team is doing. Decisions based on what happened, not on a hunch.
The problem
Sound familiar?
You do not really know what you earn
At month end you do rough sums. The actual margin, the services worth most, the growth on last month, all of it stays a guess.
Decisions made on instinct
You raise prices because it feels like the moment. You hire because it feels busy. Without numbers, every call is a bet.
Nothing joins up
Appointments in one place, takings in another, clients in a third. Nothing puts them together into a single picture.
The solution
How CiaoBarber solves it
- A dashboard with the key figures, updated as you work
- Revenue charts by day, week and month
- Services and barbers ranked by performance
- No-show trends and client return rates
Perché scegliere CiaoBarber?
The barbers who do best are not always the ones cutting the most hair. They are the ones who know their numbers. Knowing what you take in a day, which service carries the best margin, which barber performs best and which day brings the most no-shows is the difference between running a shop and growing a business. The CiaoBarber dashboard puts the figures that matter within a glance, updated as you work and drawn as charts you can actually read.
01
A dashboard with the key figures, updated as you work
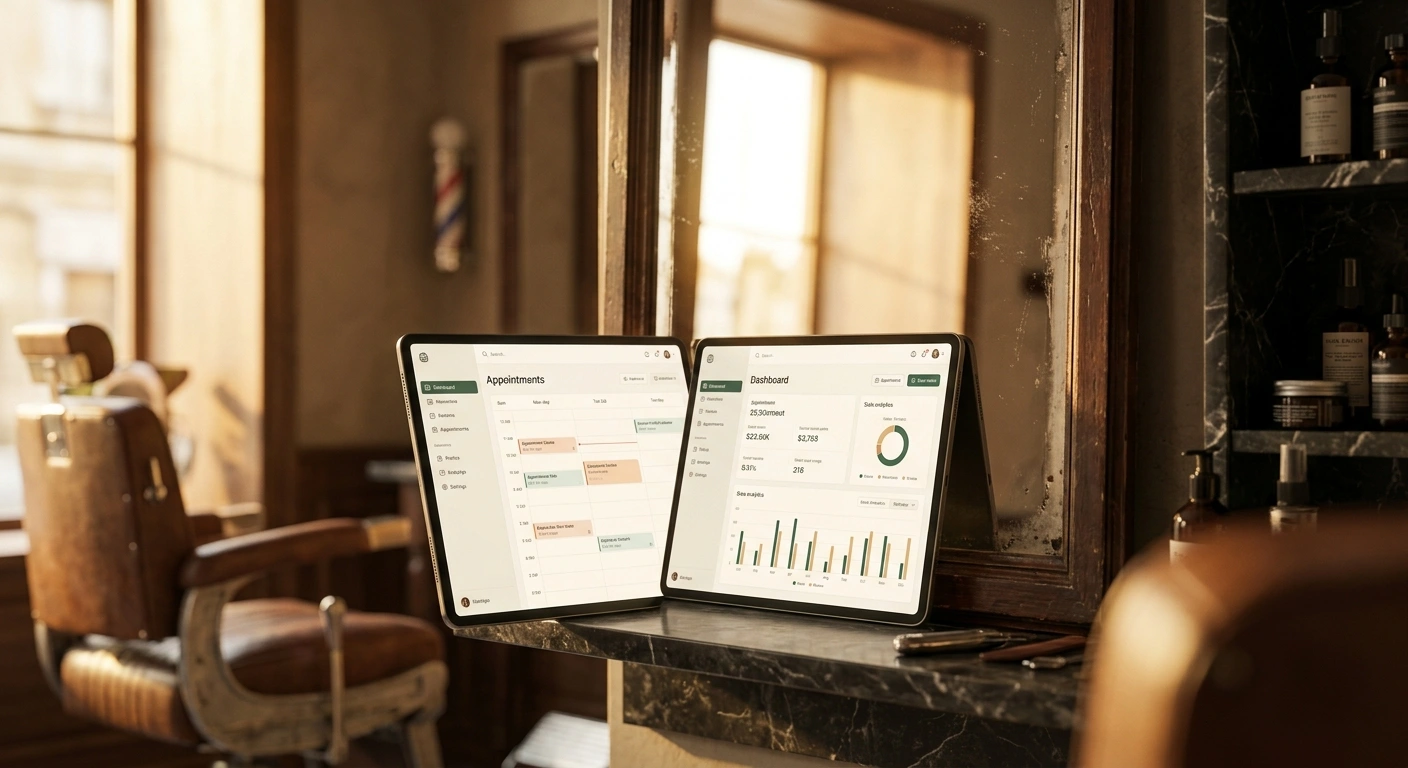
The figures cover the whole business: revenue this month against last, appointments today and this month, total and new clients, active staff, revenue day by day, how each barber is performing, and warnings about stock running low. Everything can be filtered by period, by barber and by service, so you can look at the business from whichever angle you need.
02
Revenue charts by day, week and month
Where analytics earn their keep is in concrete decisions. Finding that a large share of revenue comes from a handful of services tells you where to push. Seeing no-shows cluster on one day tells you where an extra reminder would pay. Noticing that one barber has the highest client return rate tells you who to invest in. Without the data those decisions are guesswork. With it they are mostly obvious.


03
Services and barbers ranked by performance
The barbers who do best are not always the ones cutting the most hair. They are the ones who know their numbers. Knowing what you take in a day, which service carries the best margin, which barber performs best and which day brings the most no-shows is the difference between running a shop and growing a business. The CiaoBarber dashboard puts the figures that matter within a glance, updated as you work and drawn as charts you can actually read.
How it works
Up and running in a few steps
Just use CiaoBarber
There is nothing special to do. Every appointment, every sale and every client interaction feeds the dashboard automatically. The more you use it, the more there is to see.
Open the dashboard
From your account home you get the main figures straight away, with the current values and a comparison against the previous period.
Filter and dig in
Choose the period you care about, today, this week, this month or a custom range, and filter by barber or by service. The charts update instantly.
Decide with something to go on
Use it to judge when to raise prices, which services to promote, whether to hire, what to order more of and where costs are leaking. Every call is backed by something real.
Real time
Key figures always current, with no spreadsheet
One view
Revenue, appointments, clients and staff in one place
CSV export
Hand the numbers straight to your accountant
FAQ
Frequently asked questions
Do I have to enter data by hand to see the figures?+
Can I export reports for my accountant?+
Can my barbers see the figures too?+
Torna alla Sedia.
Let CiaoBarber handle the admin. You go back to what you love: cutting, creating, inspiring.
Start FreeNo card required. 30 days free.
Other solutions
Keep exploring- Every appointment in its place. Every time.Run your barbershop diary without the phone. No double bookings, no lost slots, no interruptions mid-cut. Start free with CiaoBarber.
- Your shop, online. In three minutes.Put your barbershop online in three minutes. Clients choose the service, the barber and the time without a single phone call. Try it free.
- Take payment in a tap. Account for every cent.A till built for barbers. Take cash, card or PayPal QR, issue receipts instantly and track every euro. Start free with CiaoBarber.
- Your team, organised. Without a meeting.Run your team with roles, permissions and individual calendars. Each barber sees only their own appointments. Try it free.
- Shelves that stay stocked.Track products, get low stock alerts and keep your suppliers in one place. No more empty shelves on a Saturday. Start free with CiaoBarber.